Three Black Crows Candlestick Pattern
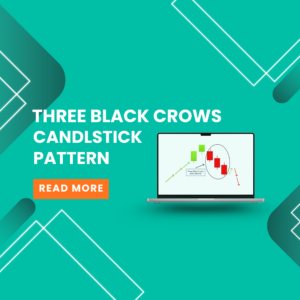
The study of price behavior on charts is known as technical analysis. Candlestick patterns,
Three Black Crows Candlestick Pattern Read Post »

Chat with us on WhatsApp
for any queries
The study of price behavior on charts is known as technical analysis. Candlestick patterns,
Three Black Crows Candlestick Pattern Read Post »

candlestick patterns have been a fundamental component of technical analysis.
The Shooting Star Candlestick Pattern: A Complete Guide for Traders Read Post »
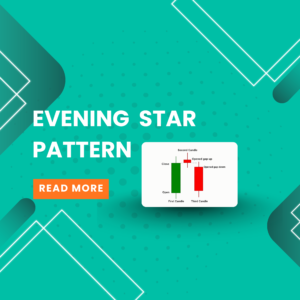
Candlestick patterns are a key tool in technical analysis for spotting trend reversals.
Evening Star Pattern: Meaning, Trading Strategy, Examples & Chart Explanation Read Post »

One of the most adaptable and effective ways to engage in the
Mastering Options Strategies: A Comprehensive Roadmap to Smarter Options Read Post »
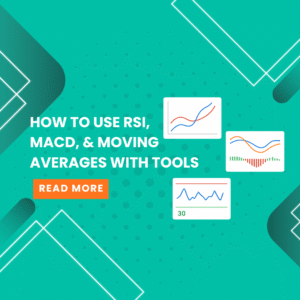
MACD (Moving Average Convergence Divergence) is a directional momentum indicator that depicts the
How to Use RSI, MACD, and Moving Averages with Tools Read Post »
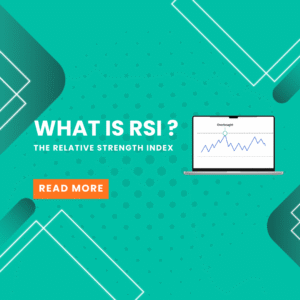
The Relative Strength Index (RSI) is a momentum indicator that compares the speed and amplitude of recent market
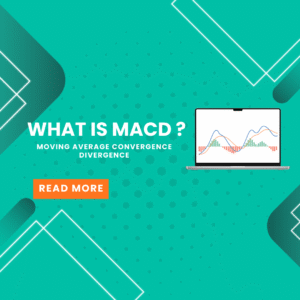
MACD (Moving Average Convergence Divergence) is a trend-following momentum indicator that depicts the relationship between two exponential

The first stage in investing in the Indian stock market, mutual funds, exchange-traded funds (ETFs), initial
How to Open Demat Account Online in India Read Post »

A Systematic Investment Plan (SIP) makes investing simple and disciplined, but it can appear difficult
How to invest in SIP for Beginners Read Post »

Trading in the financial markets can feel exciting and a little alarming to start.
How to learn trading for beginners Read Post »