Candlestick patterns are a key tool in technical analysis for spotting trend reversals. The Evening Star Pattern is among the most trustworthy bearish reversal indicators. This pattern is used by traders in the stock, forex, and cryptocurrency markets to identify possible market peaks and get ready to sell.
Following a robust rally, the Evening Star Pattern appears, indicating a slowdown in purchasing pressure. It can help traders avoid purchasing at market peaks and increase overall trading accuracy when properly understood and paired with confirmation tools.
What Is the Evening Star Pattern?
The Evening Star Pattern, a three-candlestick bearish reversal pattern, appears toward the end of an uptrend. It represents a change from bullish dominance to bearish dominance.
This pattern suggests that:
Buyers are losing momentum
Market sentiment is shifting
A downward price move may follow
Because it reflects market psychology so clearly, the Evening Star Pattern is widely respected in price action trading.
Market Psychology Behind the Evening Star Pattern:
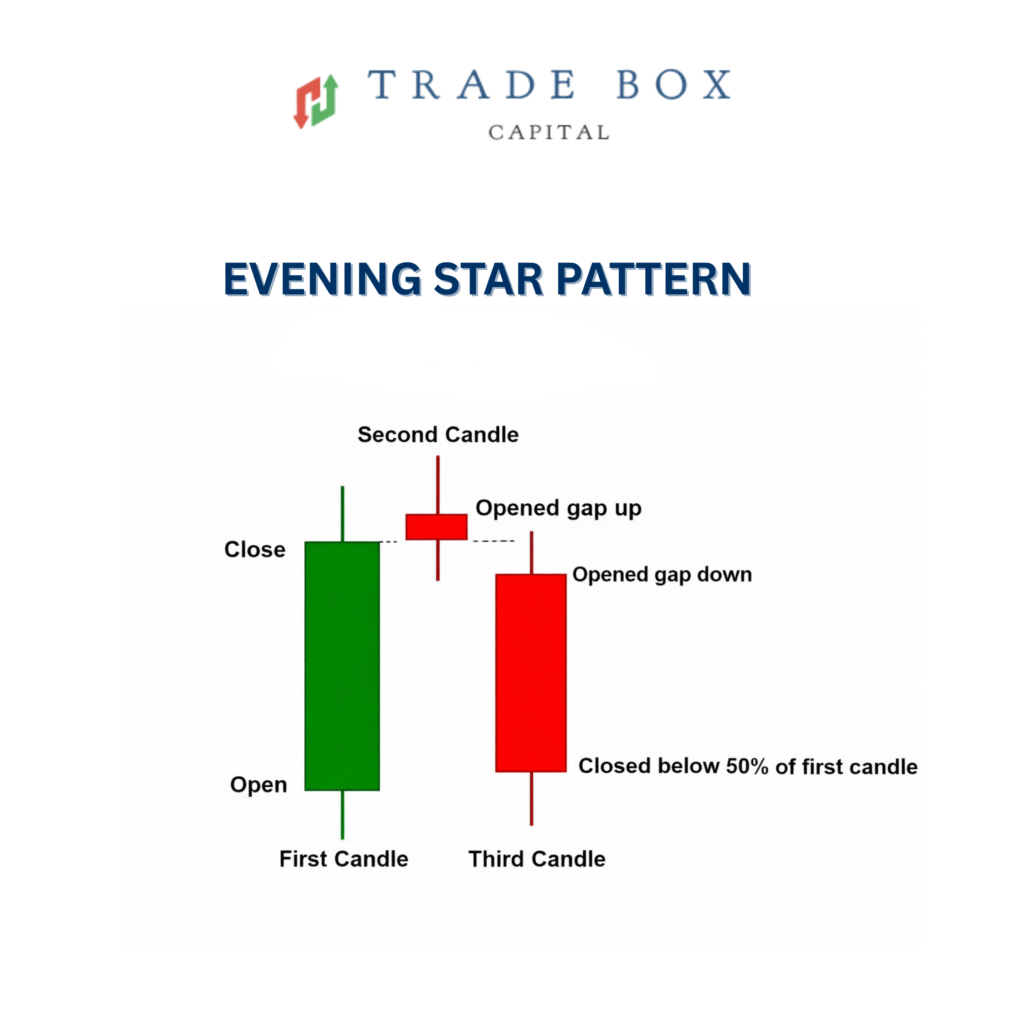
Structure of the Evening Star Pattern
The pattern consists of three specific candles, each with a clear role.
1. First Candle – Strong Bullish Candle
Large green candle
Confirms strong buying pressure
Appears during an established uptrend
2. Second Candle – Small Body Candle
Small body (Doji or Spinning Top)
Can be bullish or bearish
Shows indecision and weakening momentum
3. Third Candle – Strong Bearish Candle
Large red candle
Closes well into the first candle’s body
Confirms seller dominance
Market Psychology Behind the Evening Star Pattern:
The psychology behind the Evening Star Pattern explains why it works so well:
In Trading terms, the Evening Star Pattern means:
Bulls push price higher with confidence
Momentum slows as traders hesitate
Bears step in aggressively and overpower buyers
This shift often marks the beginning of a bearish reversal.
Meaning of the Evening Star Pattern in Trading:
The uptrend may be exhausted
Risk of holding long positions increases
Short or sell opportunities may appear
It is not a guarantee of a price fall, but it acts as an early warning signal.
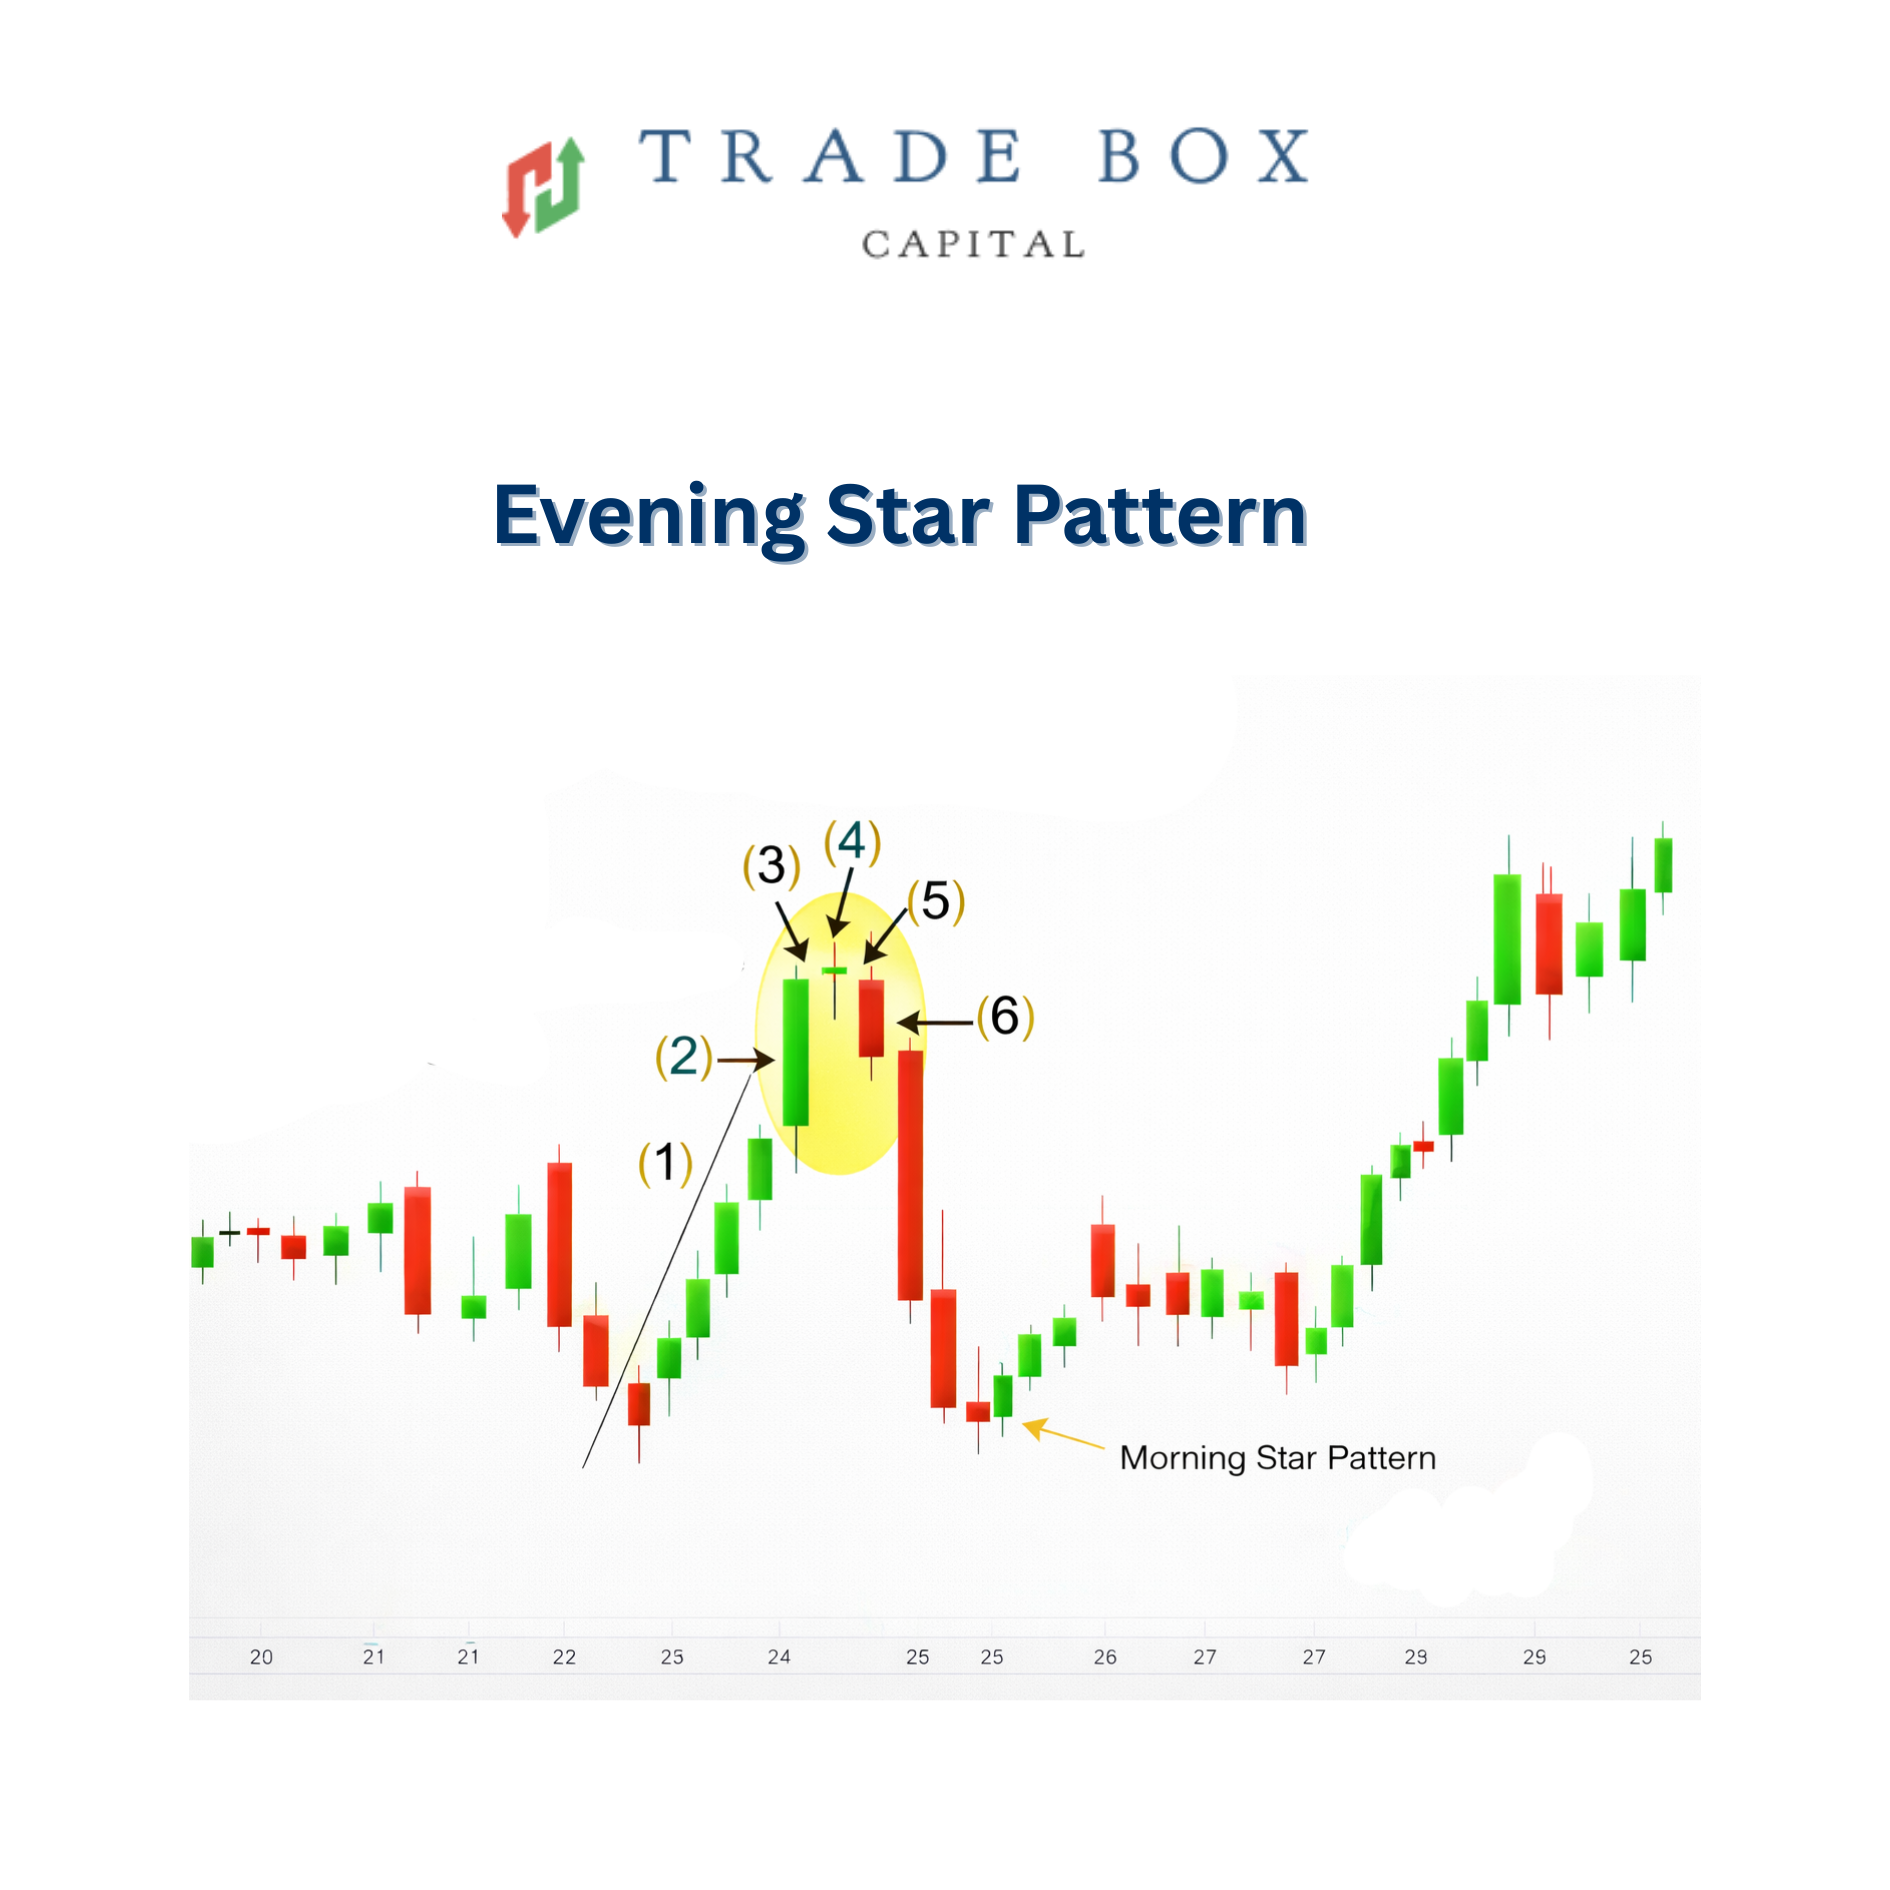
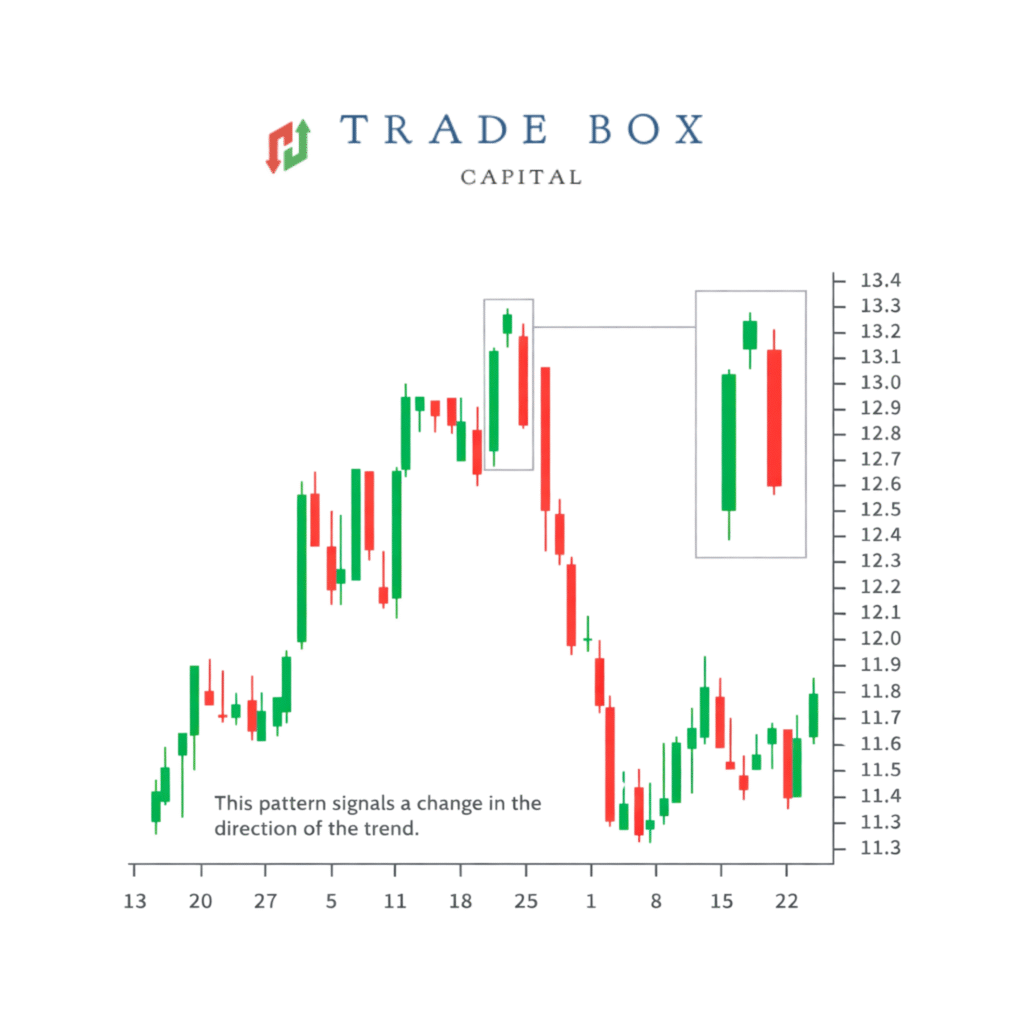
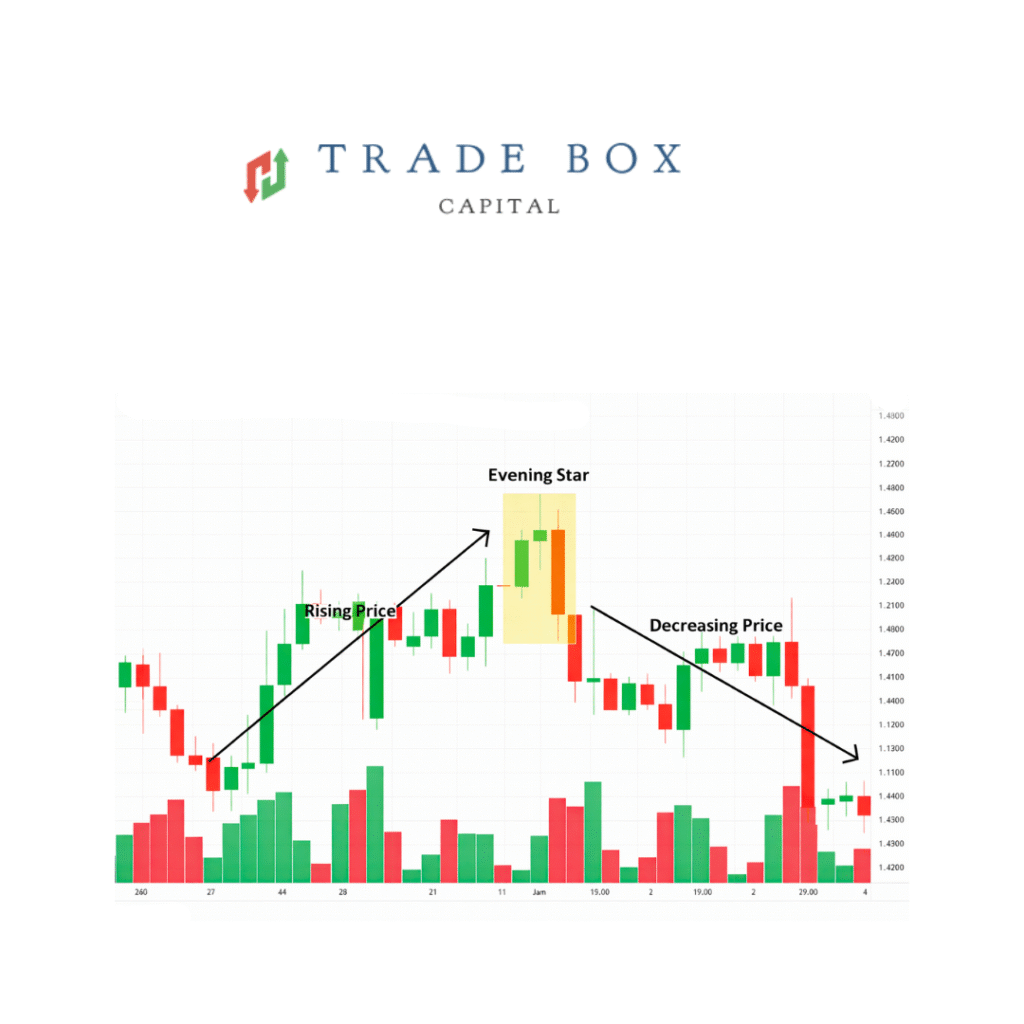
Evening Star Pattern Trading Chart Examples:
On charts, the Evening Star Pattern becomes stronger when it forms:
Near resistance levels
After a sharp bullish rally
With increased volume on the third candle
How to Trade the Evening Star Pattern (Step-by-Step):
Step 1: Identify a Strong Uptrend
Price should be making higher highs and higher lows.
Step 2: Wait for the Pattern to Complete
Never trade before the third candle closes.
Step 3: Look for Confirmation
Best confirmation tools include:
RSI above 70 (overbought condition)
MACD bearish crossover
Resistance or supply zones
Step 4: Entry Point
Enter a sell trade below the low of the third candle.
Step 5: Stop-Loss Placement
Place stop-loss:
Above the high of the second candle, or
Above the highest wick of the pattern
Step 6: Take-Profit Target
Nearest support level
Or use a minimum 1:2 risk-reward ratio
Multiple Trading Examples:
Example 1: Stock Market
A stock rallies strongly and forms an Evening Star Pattern near a resistance zone. After confirmation, price reverses sharply downward.
Example 2: Forex Market
In an uptrending currency pair, the pattern appears near a previous high with RSI overbought. A sell trade results in a controlled bearish move.
Example 3: Cryptocurrency Market
Crypto assets often form Evening Star Patterns after aggressive bullish candles, leading to fast pullbacks or trend reversals.
Best Timeframes for the Evening Star Pattern:
Timeframe
Reliability
5–15 Minutes
Low
1 Hour
Medium
4 Hour
High
Daily
Very High
Weekly
Extremely Strong
Higher timeframes reduce false signals.
Common Mistakes Traders Make:
Feature
Evening Star
Morning Star
Trend Type Bearish
reversal
Bullish reversal
Appears After
Uptrend
Downtrend
Trade Signal
Sell
Buy
Conclusion:
The Evening Star Pattern is one of the most effective bearish reversal patterns in technical analysis. When combined with trend analysis, indicators, and proper risk management, it helps traders identify market tops and protect profits.
Mastering this pattern allows traders to react early—before major reversals unfold.
Frequently Asked Questions
1. What is the Evening Star Pattern?
The Evening Star Pattern is a bearish reversal candlestick pattern that appears at the top of an uptrend, signaling a possible trend reversal from bullish to bearish.
2. How many candles form the Evening Star Pattern?
It consists of three candlesticks:
First: A strong bullish candle
Second: A small-bodied candle (indecision)
Third: A strong bearish candle
3. What does the Evening Star Pattern indicate?
It indicates weakening buying pressure and a potential downward reversal in price.
4. Where does the Evening Star Pattern usually appear?
It typically appears after an uptrend and near resistance levels or market tops.
5. Is the Evening Star Pattern reliable?
Yes, it is considered a reliable bearish reversal pattern, especially when: