

What Is Directional Trading?
Imagine you are standing at a bus stop and you notice the traffic on the main road is building up. You decide to leave early because you think the bus will be late. That is a directional call. You looked at the evidence, picked a direction, and acted.
Directional trading works the same way. A trader studies a stock, index, currency or commodity and forms a view: “This is likely to go up” or “This is likely to go down.” Then the trader takes a position that profits if the view turns out right.
The key word is direction. The trader cares less about how fast or how far a price moves and more about which way it moves. If you are right about the direction, you can make money. If you are wrong, you take a loss.
This makes directional trading the most intuitive way of trading. It also makes it easy to get wrong, because nobody predicts markets correctly all the time.

How Does Directional Trading Work?
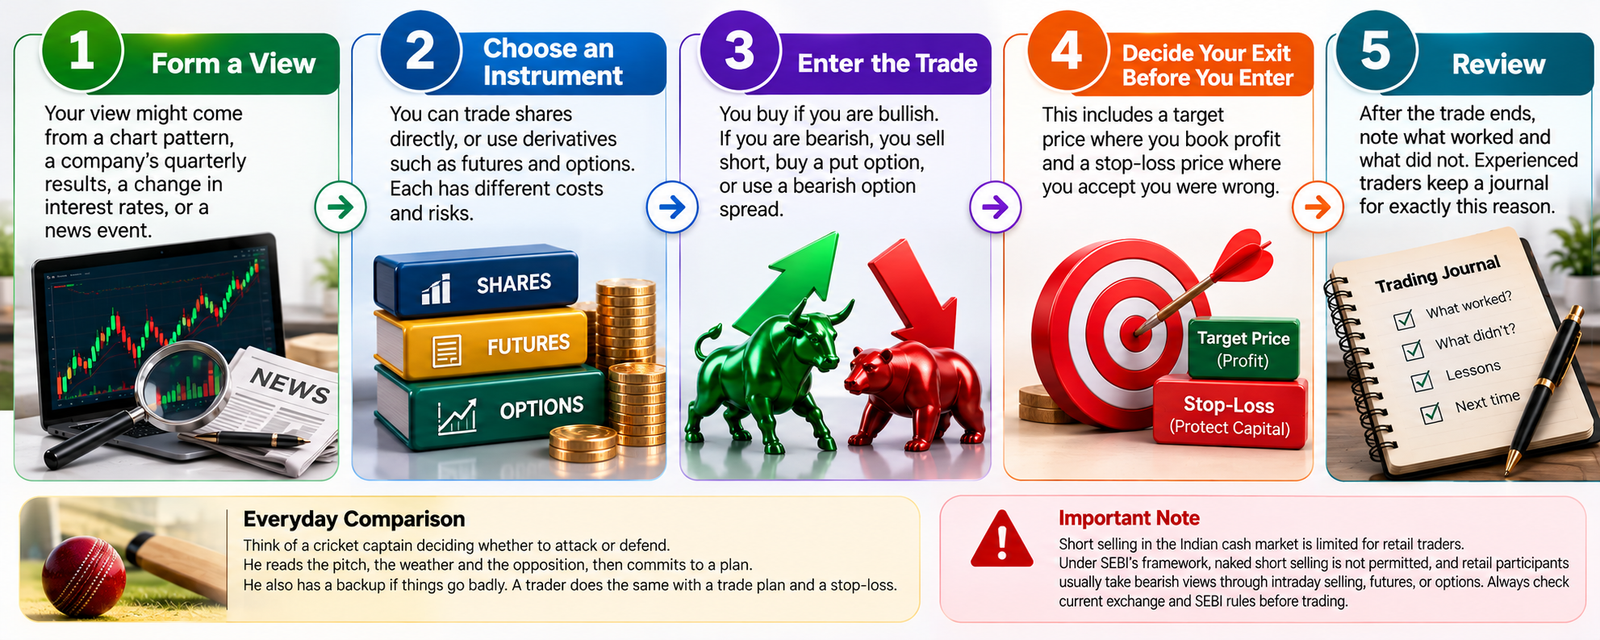
The process follows a simple chain: view, instrument, entry, exit.
Step 1: Form a view. Your view might come from a chart pattern, a company’s quarterly results, a change in interest rates, or a news event.
Step 2: Choose an instrument. You can trade shares directly, or use derivatives such as futures and options. Each has different costs and risks.
Step 3: Enter the trade. You buy if you are bullish. If you are bearish, you sell short, buy a put option, or use a bearish option spread.
Step 4: Decide your exit before you enter. This includes a target price where you book profit and a stop-loss price where you accept you were wrong.
Step 5: Review. After the trade ends, note what worked and what did not. Experienced traders keep a journal for exactly this reason.
Here is a quick everyday comparison. Think of a cricket captain deciding whether to attack or defend. He reads the pitch, the weather and the opposition, then commits to a plan. He also has a backup if things go badly. A trader does the same with a trade plan and a stop-loss.
One point deserves emphasis. Short selling in the Indian cash market is limited for retail traders. Under SEBI’s framework, naked short selling is not permitted, and retail participants usually take bearish views through intraday selling, futures, or options. Always check current exchange and SEBI rules before trading.
Types of Directional Trading Strategies
There is no single “correct” method. Different styles suit different personalities and schedules. Here are the main ones.
Trend-Following Strategy
The idea is simple: the trend is your friend. If a stock has been climbing steadily, you buy and hold until the climb shows signs of ending. If it has been sliding, you stay away or take a bearish position.
Think of a river. It is far easier to float with the current than to swim against it. Trend followers rarely try to catch the exact bottom or top. They accept the middle part of a move.
Breakout Strategy
Prices often bounce inside a range for weeks. A breakout happens when the price pushes decisively beyond the top of that range (resistance) or below the bottom (support), usually with higher trading volume.
A kettle is a fair picture here. Pressure builds quietly, then the lid pops. Breakout traders try to enter when the lid pops. The risk is a false breakout, where the price slips back inside the range and traps early buyers.
Momentum Strategy
Momentum traders buy what is already moving strongly and sell what is weakening. They believe strength tends to continue for a while. Rising volume and strong earnings reactions often draw their attention.
Swing Trading
Swing traders hold positions for a few days to a few weeks. They aim to capture one “swing” within a bigger trend. This style suits people with day jobs, because it does not demand constant screen time.
Intraday (Day) Trading
Here, every position is closed on the same day. Gains and losses can arrive fast. SEBI’s research on individual traders has repeatedly shown that most people who trade very frequently lose money, so this style needs experience and discipline.
Position Trading
Position traders hold for several months, sometimes longer, based on broader trends such as an economic cycle or a sector’s growth story. It is the slowest style and the closest to investing.
Options-Based Directional Strategies
Options give you the right, but not the obligation, to buy or sell at a set price before a set date. Beginners usually meet these first:
- Long call: profits if the price rises sharply enough before expiry.
- Long put: profits if the price falls sharply enough before expiry.
- Bull call spread: buy one call and sell a higher-strike call. It costs less and caps your profit.
- Bear put spread: buy one put and sell a lower-strike put. It is the bearish mirror image.
Spreads limit both the maximum loss and the maximum gain, which is why many educators introduce them before more aggressive trades.
Bullish vs. Bearish Directional Trading
A bullish trader expects prices to rise. A bearish trader expects prices to fall. The names come from how the animals attack: a bull thrusts its horns upward, while a bear swipes its paws downward.
| Feature | Bullish Trading | Bearish Trading |
| Market view | Price will rise | Price will fall |
| Common actions | Buy shares, buy futures, buy calls, bull call spread | Intraday short sale, sell futures, buy puts, bear put spread |
| Typical signals | Higher highs, price above key moving averages | Lower lows, price below key moving averages |
| Maximum profit (shares) | Theoretically unlimited | Limited, since price cannot fall below zero |
| Maximum loss (shares) | Limited to the amount invested | Can be very large when shorting without a stop |
| Emotional pull | Greed and overconfidence | Fear and impatience |
Bullish trades feel natural to most people because we are used to buying things. Bearish trades feel unnatural and often carry extra risks, so beginners should read the rules carefully before trying them.
Popular Directional Trading Indicators
Indicators are tools that turn raw price data into something easier to read. None of them predict the future. They simply tilt the odds or highlight conditions.
Moving Averages (MA). A moving average smooths out price noise by averaging recent closing prices. When price stays above the 50-day or 200-day average, many traders see an uptrend. A “golden cross” (50-day crossing above 200-day) is often read as bullish, and a “death cross” as bearish.
Relative Strength Index (RSI). Developed by J. Welles Wilder, RSI moves between 0 and 100. Readings above 70 are often called overbought, and below 30 oversold. In strong trends, though, RSI can stay “overbought” for a long time, so treat it as a clue, not a command.
MACD (Moving Average Convergence Divergence). MACD compares two moving averages to show momentum shifts. A crossover of the MACD line and its signal line is a common entry hint.
Average Directional Index (ADX). ADX measures trend strength, not direction. A reading above about 25 is commonly seen as a meaningful trend.
Volume. Rising volume during a price move suggests more participants believe in it. A breakout on thin volume deserves suspicion.
Support and Resistance. These are price zones where buyers (support) or sellers (resistance) have repeatedly stepped in. Many traders place stop-losses just beyond them.
A practical tip: pick two or three indicators and learn them well. Stacking ten indicators on one chart creates confusion, not confidence.
Directional Trading Examples
The examples below use made-up numbers purely for teaching. They are not recommendations, and real trades involve brokerage, taxes and price slippage.
Example 1: A Bullish Swing Trade on a Share
Suppose a hypothetical company, ABC Ltd., trades at ₹500. Over two months it has formed higher lows and just closed above a resistance level at ₹505 on strong volume.
A swing trader buys 100 shares at ₹506. She sets a stop-loss at ₹488, just under the recent support. Her target is ₹542.
- Risk per share: ₹506 − ₹488 = ₹18
- Potential reward per share: ₹542 − ₹506 = ₹36
- Risk-to-reward ratio: 1:2
If the stop is hit, she loses about ₹1,800 (before costs). If the target is reached, she makes about ₹3,600. Notice that she can be wrong more often than right and still do reasonably well, because her wins are larger than her losses. That is the quiet power of a sensible risk-to-reward ratio.
Example 2: A Bearish View Using a Bear Put Spread
Say an index sits at 22,000 and a trader expects a moderate fall over the next two weeks after a weak earnings season. Instead of buying a single put, he buys a 22,000 put and sells a 21,600 put with the same expiry.
The premium he pays on the first is partly offset by the premium he collects on the second. His maximum loss is the net premium paid. His maximum gain is the gap between strikes (400 points) minus that net premium.
The trade-off? If the index crashes to 21,000, his profit is still capped at the 21,600 level. He gave up unlimited downside gains in exchange for a cheaper, more controlled trade.
Example 3: A Trend-Following Position
A position trader notices that a large private bank’s share has stayed above its 200-day moving average for six months, and the broader banking index is also rising. She buys in three equal parts as the price dips toward the 50-day average. She plans to exit if the price closes below the 200-day average.
Her approach is slow, boring and calm. Many experienced traders would say that is a good sign.
Example 4: A Failed Breakout (What Goes Wrong)
A trader buys a stock as it breaks above ₹1,200, ignoring that volume was weak that day. The next morning, the price slides back to ₹1,170. Because he had no stop-loss, he waits, hopes, and eventually sells at ₹1,090.
The lesson is not that breakouts fail. It is that every trade needs an exit plan before the first rupee is risked.
Advantages and Disadvantages of Directional Trading
| Pros | Cons |
| Easy to understand: you simply pick up or down | Predicting direction is hard, even for professionals |
| Flexible: works across stocks, indices, commodities and currencies | Losses can pile up quickly, especially with leverage |
| Can profit in rising or falling markets (with the right instruments) | Needs time, patience and emotional control |
| Many learning resources and free charting tools are available | Brokerage, taxes and other costs eat into returns |
| Defined plans (stop-loss, target) create discipline | Overtrading is common, particularly among beginners |
| Short holding periods can free up capital quickly | Market news and sudden gaps can break any technical setup |
No strategy removes risk. A strategy only helps you decide how much risk to take and when to step away.
Risk Management in Directional Trading
If trading were a car, risk management would be the brakes. Nobody drives fast without them.
Use a stop-loss on every trade. A stop-loss is a preset price at which you exit to limit your loss. Decide it before entering, not after the price starts falling.
Risk a small slice per trade. Many educators suggest keeping the loss on any single trade to a small fraction of your trading capital, often around 1% to 2%. This is a common teaching rule, not a guarantee of safety. With 1% risk, ten losses in a row would still leave most of your capital intact.
Aim for a healthy risk-to-reward ratio. A ratio of at least 1:2 means you target twice what you risk. Combined with a reasonable hit rate, this can keep the maths in your favour over many trades.
Be careful with leverage. Futures and options allow you to control a large position with a smaller upfront payment (margin). This magnifies gains and losses. SEBI has repeatedly cautioned retail investors about the risks of leveraged derivatives.
Separate trading money from essential money. Never use funds meant for rent, school fees, medical needs or emergencies. Money you cannot afford to lose should not be in a directional trade.
Keep a journal. Record the reason for each trade, your entry and exit, and how you felt. Patterns in your mistakes become visible surprisingly fast.
Common Mistakes to Avoid in Directional Trading
Most errors are not technical. They are human.
- Trading without a stop-loss. Hope is not a strategy.
- Chasing tips. A WhatsApp or social media “sure shot” call has no accountability. SEBI advises investors to deal only with registered intermediaries and to be wary of unsolicited tips.
- Revenge trading. After a loss, some traders double their size to “win it back.” That usually deepens the hole.
- Overtrading. More trades do not mean more profit. They often mean more costs.
- Ignoring costs and taxes. Brokerage, transaction charges and taxes can turn a small profit into a loss.
- Fighting the trend. Trying to call every top or bottom is exhausting and expensive.
- Using too much leverage. A small move against you can wipe out a large share of your capital.
- Skipping the learning phase. Jumping in with real money before practising is like entering a swimming race after reading a pamphlet.
Directional Trading in the Stock Market
In the Indian market, directional trades usually take place on exchanges such as NSE and BSE, regulated by SEBI.
Cash market (equity). You buy shares and can hold them as long as you like (delivery), or trade within the day (intraday). This is the simplest, cleanest way for a beginner to take a directional view.
Futures. A futures contract is an agreement to buy or sell at a set price on a future date. Futures are leveraged, so both profits and losses scale up.
Options. Buyers of options risk only the premium paid, while sellers can face large losses. For this reason, beginners who experiment with options typically start with defined-risk trades.
What moves direction? Company earnings, sector news, global cues, foreign institutional flows, commodity prices and policy announcements all matter. For instance, RBI’s decisions on the repo rate can influence banking and real-estate stocks, and sometimes the broader market mood. Following RBI’s official announcements (rbi.org.in) gives you information straight from the source.
A note on alternatives. If you would rather not trade actively, long-term investing through diversified options such as mutual funds is another route. AMFI (amfiindia.com) offers investor education on mutual funds, and many people use them for goals that stretch over many years. Directional trading and long-term investing serve different purposes, and neither is automatically better.
Best Timeframes for Directional Trading
There is no universal “best” timeframe. The right one depends on your time, temperament and capital.
| Style | Typical Holding Period | Chart Timeframes Often Used | Suits Someone Who… |
| Intraday | Minutes to hours (same day) | 1-minute to 15-minute | Can watch markets full-time and handle quick decisions |
| Swing | Days to weeks | 1-hour to daily | Has limited time but can review charts daily |
| Position | Months or longer | Daily to weekly | Prefers a calm, big-picture approach |
A helpful habit is multi-timeframe analysis. First, check the weekly or daily chart to understand the main trend. Then zoom into a shorter chart to find a precise entry. Think of it as looking at a city map first and street view later.
Beginners often start with swing or position styles, because slower decisions leave more room to think.
How to Identify Entry and Exit Points
Good entries and exits are rarely perfect. They are reasonable and repeatable.
Finding entries
- Pullbacks in a trend: Wait for a temporary dip toward a moving average or a support zone, then look for signs the price is turning up again.
- Breakouts with volume: Enter once price closes beyond a key level, ideally with above-average volume.
- Confirmation signals: An RSI turning up from a low zone, or a MACD crossover, can add a second reason to act.
Finding exits
- Stop-loss exit: Set just beyond a recent swing low (for a buy) or swing high (for a sell). If the price hits it, your idea has failed.
- Target exit: Use the next resistance or support level, or a fixed risk-to-reward multiple such as 1:2.
- Trailing stop: As the price moves in your favour, move your stop closer behind it to lock in some gains.
- Time exit: If a trade goes nowhere for too long, close it and free up your capital.
Here is a plain rule of thumb: if you cannot explain your entry, stop-loss and target in two sentences, the plan is not ready.
Directional Trading vs. Non-Directional Trading
Non-directional trading tries to earn from time passing, price staying within a range, or changes in volatility, rather than from a clear up or down move. Examples include certain option combinations such as straddles, strangles and iron condors, as well as arbitrage approaches.
| Aspect | Directional Trading | Non-Directional Trading |
| Core idea | Profit from price moving a particular way | Profit from range-bound prices, time decay or volatility changes |
| Main question | “Which way will it go?” | “Will it stay within a range?” or “Will volatility change?” |
| Typical tools | Shares, futures, calls, puts, vertical spreads | Straddles, strangles, iron condors, arbitrage |
| Complexity | Generally simpler to grasp | Often more complex, with several moving parts |
| Biggest risk | Being wrong about direction | Sudden large moves or volatility spikes |
| Beginner-friendliness | Easier to start learning | Usually better after gaining experience |
Neither approach is risk-free. Non-directional strategies can look “safe” because they win often, yet a single sharp move can cause losses larger than many small wins combined.
Myth vs. Fact
| Myth | Fact |
| “Good traders are right almost every time.” | Many successful traders are right less than 60% of the time, but they keep losses small and let winners run. |
| “Indicators can predict the market.” | Indicators summarise past price behaviour. They help with decisions but do not predict the future. |
| “Short selling is only for experts.” | Anyone can learn it, but the risks are higher and the rules are stricter, so careful study comes first. |
| “More trades mean more profit.” | More trades usually mean more costs and more chances for emotional errors. |
| “A stop-loss guarantees my loss limit.” | In fast markets or overnight gaps, execution can happen at a worse price than your stop. |
| “Options are always cheaper and safer than shares.” | Options can expire worthless and carry their own complexities, including time decay. |
Tips for Beginners to Start Directional Trading
Learn first, trade later. Read SEBI’s investor education material, exchange tutorials and reputable books. Spend a few weeks understanding basics before placing any trade.
Paper trade. Practise with virtual money to test your strategy without risking real funds. Many broker platforms offer this.
Start small. Your early goal is to learn, not to earn. Use a small amount you can afford to lose entirely.
Pick one strategy. Master one setup, such as pullback entries in an uptrend, before adding another.
Check your broker. Trade only through SEBI-registered brokers. You can verify registration on SEBI’s website.
Understand the tax side. Profits from trading are taxed under rules that depend on the instrument and holding period. Speak with a qualified tax professional for your situation.
Control your emotions. Take a break after a big loss or a big win. Both can cloud judgment.
Stay sceptical. Be wary of anyone promising assured profits. No legitimate trader or adviser can guarantee returns.
Beginner Checklist
- I understand what directional trading is and how it can lose money.
- I have read SEBI’s investor material on risks in equity derivatives.
- I trade only with a SEBI-registered broker.
- I have separated my trading money from emergency and household funds.
- I have practised at least a few weeks on paper trades.
- I know my entry, stop-loss and target before every trade.
- I limit my risk per trade to a small, fixed percentage of capital.
- I have a trading journal to record every trade.
- I have considered brokerage, charges and taxes.
- I will not follow unverified tips.
Key Takeaways
- Directional trading means profiting from a price moving up or down.
- Common styles include trend following, breakouts, momentum, swing, intraday and position trading.
- Indicators such as moving averages, RSI, MACD and ADX help read the market but never predict it.
- A stop-loss, small position size and healthy risk-to-reward ratio matter more than any single setup.
- Official research from SEBI shows most individual derivatives traders lose money, so caution and education are essential.
- Non-directional strategies exist, but they are not automatically safer.
Conclusion: Is Directional Trading Right for You?
Directional trading rewards patience, planning and humility. It does not reward guesswork, tips or big bets. The people who last in this field usually treat it like a craft: they study, practise, review their mistakes and protect their capital first.
Ask yourself a few honest questions. Do you have spare money that is not needed for essentials? Can you accept losing some of it while you learn? Do you have the time and temperament to follow a plan even when emotions pull the other way? If the answers are yes, you can start slowly with small positions and a learning mindset.
If the answers are no, that is perfectly fine. Long-term investing, such as regular contributions to diversified mutual funds, suits many people better. You can learn more about those options through AMFI’s investor education resources.
Whatever route you choose, remember that markets reward preparation far more than prediction.
Directional trading is taking a position based on your view that a price will move up or down. You profit if the price moves the way you expected and lose if it moves against you.
The most common ones are trend following, breakout trading, momentum trading, swing trading, intraday trading and position trading. Traders also use options-based approaches such as long calls, long puts, bull call spreads and bear put spreads.
It is one of the easier styles to understand, but it is not low-risk. Beginners should learn the basics, practise with paper trades and start with small amounts they can afford to lose.
Directional trading depends on price moving up or down. Non-directional trading aims to profit from range-bound prices, time decay or changes in volatility, often using option combinations such as straddles or iron condors.
Popular choices include moving averages, RSI, MACD, ADX, volume and support and resistance levels. They help traders read trends and momentum, but they cannot predict future prices.